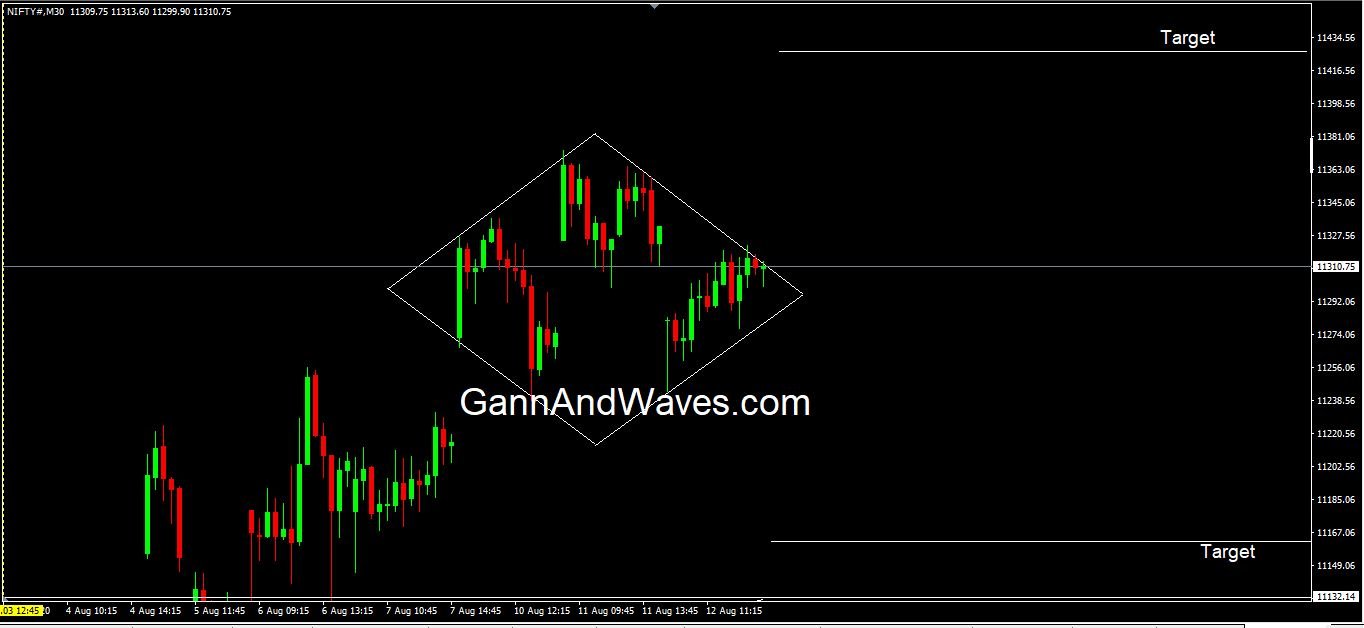
A diamond top or bottom formation is a technical analysis pattern which often occurs at or near market tops or bottom and can signal a reversal of an downtrend or uptrend. A diamond top or bottom formation is so named because trend lines connecting the peaks and bottoms troughs carved out by the commodaies, stocks, Crypto or forex’s price action form the shape of a diamond shape pattern.
It works as a session for new heights with a drag to the support level followed by a session to create new heights and rapid shrinkage that breaks the level of support for high performance.
The explosion from the lower extremities is followed by a session that performs the lower extremity in another way.
If we shift our minds to W.D. Gann’s forecasting, we set both the top and bottom targets of market shifts respectively to 11425 and 11165.

Admin
August 15, 2020Result…
https://twitter.com/gannandwaves/status/1294407597894725632