We have updated the Nifty Elliott Wave analysis of 17th January 2021 and it is valid till 18th Jan 2021. The trend was such that Nifty opened at 14594 and touched a high of 14617. But it was down by more than 250 points which made it touch the low of 14537.
And it closed at 14433 points.
It was expected that Nifty will bounce back from 14200 to 14863 in the upcoming sessions and have intraday support between 14582 to 14561 and short-term support as 14509 to 14419.
If it breaks and stays below 14561, intraday could decline between 14471 to 14435.Intraday support 14582-12561 was broken by Nifty and it declined to 14471 to 14435. It was observed that Nifty also declined below the short-term support breakeven point 14419 but it didn’t close a complete 15 minutes candle below 14419.
In this post, we will talk about the latest chart for the further prediction. Elliott Wave Analysis of Nifty with monthly chart is done below.

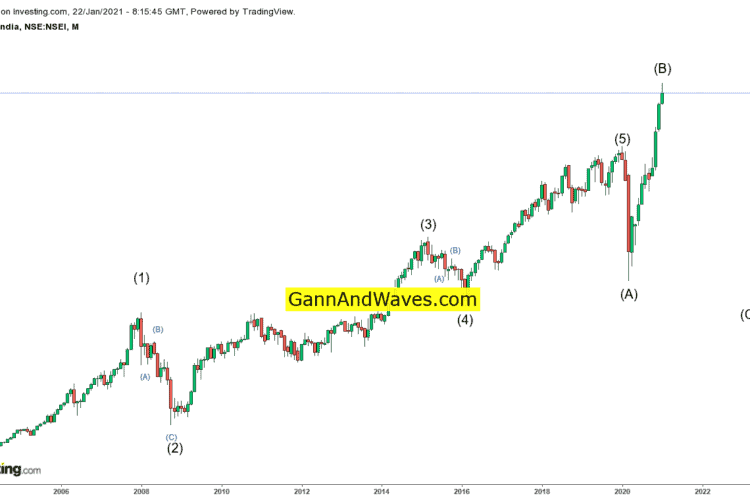
Nifty Elliott Wave Analysis Monthly Chart
If you take a look at the month-long bar chart of Nifty in which it covers life time of move, you can observe a change in Elliott Wave counts after it breaks above 12430.
The Major wave (1) lasts from 775 to 6357. The Wave (2) completion can be considered between 6357 and 2252. Wave (3) might be completed from 2252 to 12430. And Wave (4) can be considered complete between 12430 and 7511. It can be considered that the Wave (5) is still in progress.
With regards to Wave (5), it has accomplished the minimum projection after the break above 12430. 61% to 100% is placed between 14713 and 19166 – which might or might not be achieved by Wave (5).
It can be said that the 100% projection for Wave (5) is an extremely rare case. It has registered a high of 14653 till date.
If you analyse the progress of the Major Wave (5), that started from 7511 on the lowest possible time frame to check the pattern.
Daily Chart of Nifty Elliott Wave Analysis
Given above is the daily time bar chart of Nifty which shows the covering bounce post 7511, which is also the beginning of the Major Wave (5) on the monthly chart. If we divide the Wave (5) further, we can see that the inner wave(i) of (5) has been completed from 7511 to 9038. The inner wave (ii) might be completed from 9038 to 8055. The inner wave(iii) is still in progress.
If you consider 23% to 38% retracement of the progress of the entire wave (iii), 13095 to 12132 is the major downside breakeven point.
This means Nifty has a positive zone for medium and long term if you are trading above 12132. The closure of a complete weekly candle below the point of 12132 can cause a downside correction.
If you further dissect the wave(iii) you can observe that the inner wave [1] gets completed at 9889 and the inner wave [2] might get completed at 8806, the wave [3] might get completed at 11794, wave [4] might get completed at 10790 and wave [5] can be considered to be in progress.
On further analysis of the wave [5], it can be predicted that the inner wave [i] might get completed at 12025, wave [ii] might get completed at 11535, wave [iii] might get completed at 13777, wave [iv] might be completed at 13131 and the wave [v] might be in progress.
The Wave[v] has achieved the projection of minimum 38% after breaking above 14272. The next 61% projection is at 14976 which might or might not be achieved.
Now, we can analyse how the wave[v] progresses which started from 13131 on the lowest possible time frame to calculate the short-term levels and also check its pattern.
30 Minutes Chart of Nifty Elliott Wave Analysis
Shown above is the 30 minutes time bar chart of Nifty that covered a bounce after touching a low 13131 which we marked as start of wave [v] on the daily chart.
We can observe that the inner wave (1) of [v] completed from 13131-13445, wave (2) might get completed between 13445-13195, wave (3) might be completed at 14114, wave (4) may be completed at 13959 and wave (5) can be considered in progress.
After its break above 14556, the wave (5) has achieved almost 61% projection
Within wave (5), it seems inner wave (i) of (5) has been completed at 14145, whereas wave (ii) might get completed at 14043 as Irregular Correction and wave (iii) might get completed at 14653, (iv) might get completed at 14435 and wave (v) can be considered in progress.
A minimum of 38%-61% projection for wave (v) is placed between 14700 and 14863. This is the same minimum target range for completion of wave (v).
The wave [3] has its 23%-38% retracement placed between 14509 to 14419. Nifty was seen trading below 14419 and registered a low at 14357 but didn’t close the complete 15 minutes candle below 14419.
So, 14419 is still short-term downside breakeven point. It can be said that Nifty will stay in a positive zone for an extremely small term as long as you are trading above 14419 and it can bounce further towards 14700-14863.
But if Nifty trades below 14419 for more than 15 minutes, we need to check the pattern once again.
Separately, we can also have a look at the decline after all time high 14653 to check its pattern and to calculate immediate levels.
5 Minutes Chart of Nifty Elliott Wave Analysis
Given above is the 5-minute time bar chart of Nifty that covers decline after 14653 which was marked by us as the start of wave (iv) on the 30-minute chart. The decline portrays a double zigzag correction in which the first (abc) cycle is completed between 14653 and 14435. Wave(X) might get completed between 14435 and 14617. The second (abc) cycle might be completed between 14617 and 14357.
The second (abc) cycle’s inner wave (a) is completed between 14617 and 14447. The wave (b) might get completed between 14447 and 14549. The wave (c) might be completed between 14540 to 14357. If we consider the wave (c) of the second (abc) cycle the 23% -38% retracement is between 14440 to 14426. But it was observed that Nifty already closed a complete 15-minute duration candle above 14426.
The break that was observed at 14426 indicated a bounce towards 14540 to 14617 and 14426 and 14400 that can act as an immediate support. But the pattern needs to be checked once again if the Nifty trades below 14400 for more than 15 minutes.
Nifty Prediction for 18th Jan 2021 – Monday
The forecast of Nifty for tomorrow (Monday) is positive on the Elliott Wave Analysis done with the monthly, daily, 30 minutes, 15 minutes chart.
Even the medium and long-term nifty forecast is appearing positive with major support between 13095 to 12132. But if Nifty closes a complete weekly candle below 12132, it can cause a major correction once more.
When it comes to intraday Nifty forecast, that is also positive between 14426 and 14400 range as an immediate support.
Basically, Nifty lies in a positive zone if the trading is above 14400 and it also has a possibility to bounce between 14540 and 14617. But the pattern needs to be checked again in case the Nifty traders below 14400 for more than 15 minutes.
Nifty Trading Strategy for 18th Jan, 2021 – Monday
The intraday, short term low risk buying range and stoploss is between 14426 and 14400. The minimum upside target range lies between14540 to 15617 that can be extended towards the range between 14700 and 14863. The trade needs to be managed with a stoploss that is trailing after it
You can think about selling only after the close of a complete 15 minutes candle below 14400. But the low risk selling range, targets and stoploss can be achieved only after a break below 14400 is confirmed. As a trader, you can plan your individual trade according to the levels, risk tolerance capacity and the conditions which are explained.
Nifty Forecast Change during Market Hours for 18th Jan, 2021 – Monday
Gann and Waves updates its users about Nifty Elliott Wave Analysis along with the overall forecast and important levels. But the prediction can have a slight change in the case of gap openings. It can sometimes happen that the breakeven point breaks or achieves the target at the opening itself. This causes the Nifty forecast to change after achieving levels. Also, the pattern might change during market hours and result in change of the levels.
Irrespective of the fluctuations, the prediction still works most of the times. But the most accurate Nifty predictions can be made only during the marketing hours by having a look at the internal pattern.
For real time Nifty forecasting you can join our telegram channel.-
We also predict Bank Nifty, commodity, and stocks movement. You can also join our course; you can contact us on 7330-777-373.
| Join Telegram Channel | Click here |
| Contact Number | 7330-777-373 |