Gann chart analysis for gann angles is a very popular and advantageous method of analyzing a commodity or stock direction. It was invented by William Delbert Gann in 1908 and has been used by traders ever since.
The basic construction of the Gann angles remains unchanged. Simultaneously, some changes have been required to adjust some critical components related to price levels and volatility. Gann analysis can get complicated if the basic concepts of Gann angles are not clear. Gann chart and Gann angles measure pattern, price, and time frame.
One of the Gann theory’s controversies is that the past, present, and future all coexist in a Gann angle. In analyzing the history of a particular market, a trader tries to understand where the market has been, where it is relative to a previous top or bottom of Gann chart, and where it could go in the future.
How to Use Gann Chart Analysis
You can quickly draw W.D. Gann’s techniques on a chart manually or can also apply through installing a computerized technical analysis package on any computer. Many traders and analysts often compare Gann’s angles to trend lines; however, they are not the same.
A diagonal line that moves at a steady speed is nothing but a Gann Angle. In contrast, a trend line is created by connecting bottoms to bottoms to form an uptrend and tops to tops to form a downtrend.
Once you can spot a correct Gann angle, you can easily forecast where a stock’s price will be on a particular date in the future. With the Gann Analysis, you can estimate the strength and direction of the trend too.
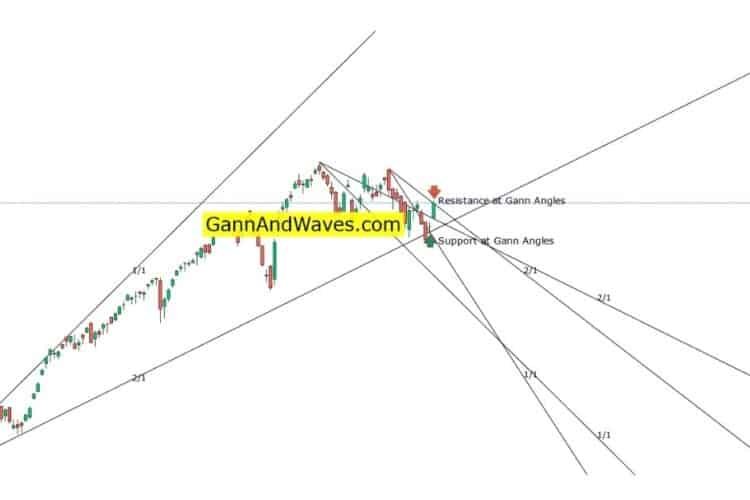
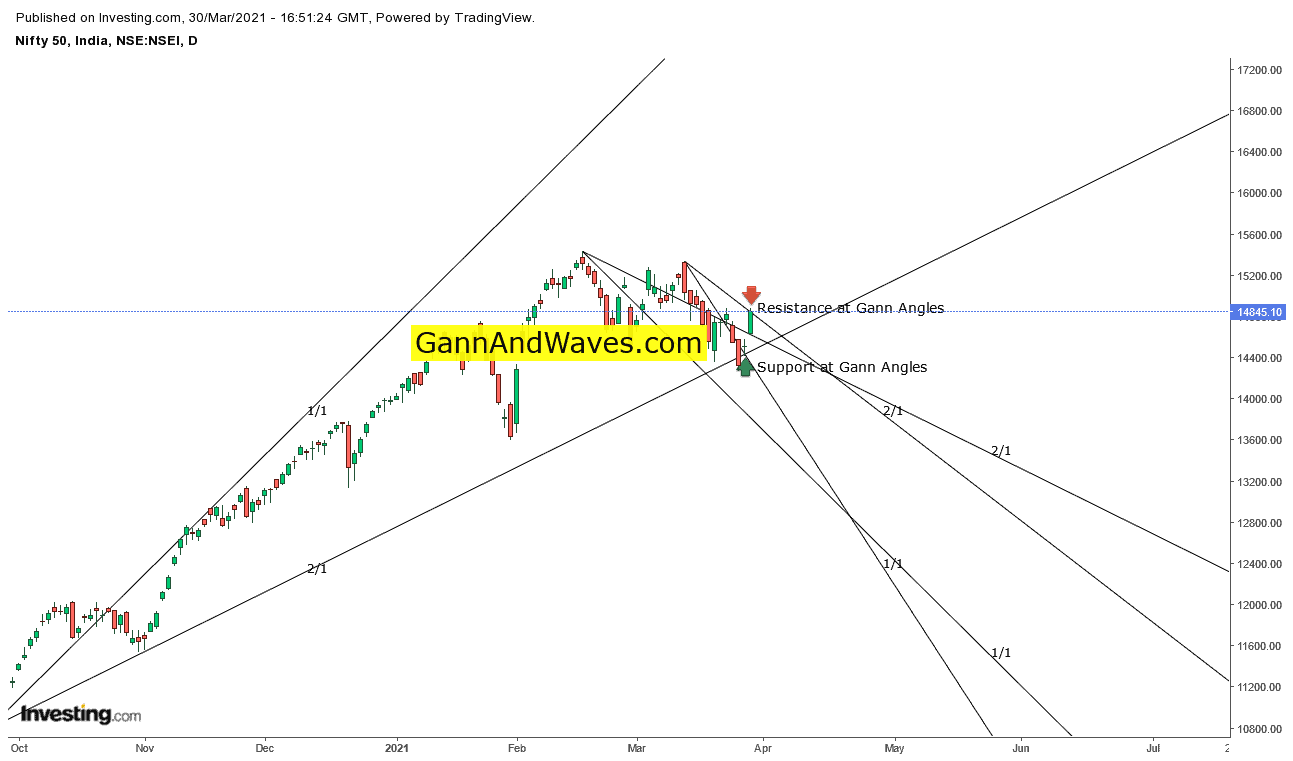
In comparison, trend lines can be less reliable in making long-term projections. Gann angles can predict support, resistance, directional strength, and timing of the top and bottom.
Where can Gann’s Theory be applied?
Gann’s Theory can be used to study patterns as explained below:
Price study: With Gann angles, you can follow the price movement of a stock. You can use the pivot levels to identify the future price of a stock. The stock price can be determined using the resistance level and support levels.
Time Study: Gann’s time study model can give traders the idea of reverse the stock price. You need to read the historical data and analyze the stock price at another point in time. To calculate this estimate, it is vital to analyze stock prices’ movement over different periods.
Pattern Study: Using patterns can help determine the movement of stocks and the activity of an investor. The pattern study includes the trend and the patterns showing the reversal of the stock movement.
Conclusion
So, as you can see, traders, stock market experts, and investors can use Gann’s Theory to study prices, time, and patterns to predict the direction of the stock market. However, before making it a part of daily trading, it is crucial to test it out and learn the basics thoroughly. This can backfire if not practiced carefully. also you can use Gann square of 9 from the home page Click Here For more information on applying the Theory to the actual market, please contact us via email or phone number.
Vinita Singhal
March 30, 2021Informative topic!
Carolswoxy
April 30, 2021Excellent reading related to gann
Janice
May 3, 2021I was wondering if you could write more on this topic? I’d be very grateful if you could elaborate a little bit further.
Bless you!
Kishore
May 4, 2021Want to learn Nifty / BankNifty do you have a related course please share details.
Manish Patel
May 8, 2021Do you teach online?
Irfan Sadiq
May 8, 2021Beautiful study love it
Audrey wef
May 11, 2021Very good analysis love to learn from you sometime