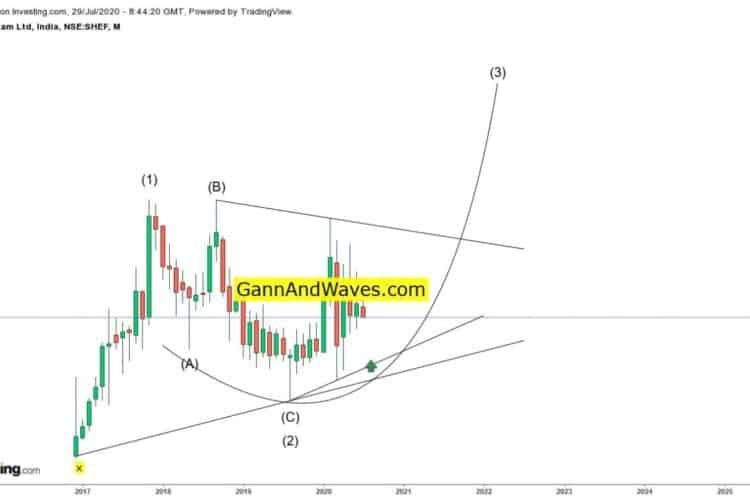
Sheela Foam Elliott Wave Pattern
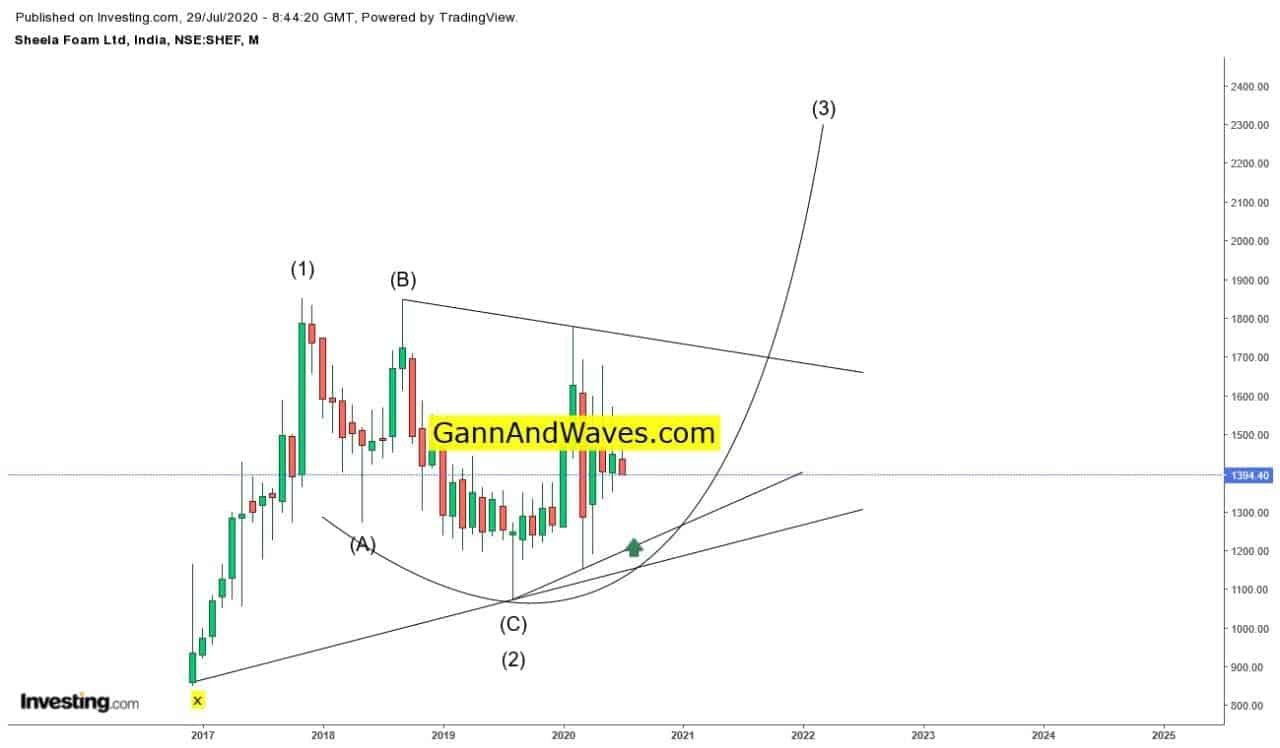
Sheela Foam Elliott Wave Pattern has become bullish and at a certain Level in time it has reached 1671 Level on 20th February 2020. From December 2019 we can see that the price of . Now due to pandemic issues, it has become so bearish that it has come to 1240 levels and then for 2300 or more levels.
As per our Elliott Wave Technical Analysis, you can see in the chart that the 3rd wave of Elliot wave is making at 1200 levels, and from here, the stock will be bullish, it is the right time for the investment in Sheela Foam based on Elliott Wave theory.
So if there is any investor who invests in the share market can buy this share and hold his position for a long-term basis. If there is any new investor he can also buy some part of the share.
Our Technical Analysis has never gone wrong because everything has been calculated as per the past and present situation with a Deep Elliott Wave analysis. So you must not miss this opportunity.
Feroz
June 1, 2021Sheela Foam Dot target done 3rd wave … from to 1222 .15 to made a high of 2382 up by 90 % in 10 months
https://www.gannandwaves.com/wp-content/uploads/2021/06/Sheela-Foam-Dot-target-done.jpg